January 30, 2010

Extraadrenal Pheochromocytoma: I-123 MIBG


Planar image (anterior view) of an I-123 MIBG scan shows intense uptake in the midline of the lower abdomen in a patient with elevated urine metanephrine.


Facts: Pheochromocytoma
  • Uncommon tumor arising from pheochromocytes of adrenal medulla, paraganglia near aorta or sympathetic ganglia
  • Common in 4th-6th decades of life, men = women
  • 10's rule: 10% bilateral, 10% malignant, 10% children, 10% extraadrenal
  • Imaging used to localize tumor after laboratory confirmation of elevated urine metanephrine or resting plasma cathecholamine
  • I-123 MIBG and/or MRI commonly utilized for localization
I-123 MIBG (meta-iodobenzylguanidine)
  • Patient preparation include: suspend all medications that could interfere with MIBG uptake for 5-6 days (i.e., calcium blocker, sympathomimetics, reserpine), use potassium iodine or sodium perchlorate orally 1 day before scanning and continue for 7 days to block thyroid uptake of unbound iodine
  • Scan done with planar imaging at 4 and 24 hours after tracer administration (300-370 MBq of I-123 MIBG)
  • Diagnosis of pheochromocytoma when 1) adrenal uptake more intense than liver, 2) extra-adrenal focal uptake seen
Imaging Workup Recommendation
Based on a study of 32 patients who underwent CT, MR and MIBG scans (each patient had all three imaging performed for research),
  • MRI alone had 93% sensitivity and positive predictive value (PPV)
  • MIBG alone had 90% sensitivity and 100% PPV
  • MRI + MIBG had 100% sensitivity and PPV

Reference:
Lumachi F, Tregnaghi A, Zucchetta P, et al. Sensitivity and positive predictive value of CT, MRI and I-123 MIBG scintigraphy in localizing pheochromocytomas: a prospective study. Nucl Med Commun 2006;27:583-587.

January 27, 2010

Measuring Radiologist Productivity


What is Productivity?
  • "Hourly worker output"
  • Productivity in physician practice reflects efficiency with which work is performed
  • Productivity gain closely correlates with health of overall economy, rising living standards and growth of real wages
Why Measuring Productivity?
  • Practice of radiologists has changed from traditional, small (less than 10 members) group to larger groups with subspecialization.
  • Increase employment of part-time radiologists
  • These factors result in difference in case mix, on-call demands and increased difficulty of informal monitoring of each radiologist's work
How?
  • Several methods exist including using revenue, hours worked, volume of examination and Relative Value Units (RVUs)
  • Because RVUs combine many facets of other methods (volumes, hours) and easily/timely availability, it is most widely used as an indicator of radiologist productivity
  • RVUs are work component of professional Resource-Based Relative Value Scale per time period. Each Current Procedural Terminology (CPT) code is assigned an RVU for physician work (wRVU) as well as RVU for practice and malpractice expenses.
  • wRVUs are intended to reflect time and effort expended by radiologists to perform services
Reference Authors' Recommendations
  • Quoted from the below reference, authors are from Mass. General Hospital in Boston and Sloan School of Management at MIT
  • RVUs seem to be the most reasonable means to evaluate radiologist productivity, however practices may elect to monitor more than one productivity measures because no single measure is perfect
  • Authors recommend measuring "team-based" RVUs rather than individual's. This is to value members who perform duties with lower RVU assignment or no RVUs (i.e., consultation, conference participation, administration, teaching)
  • Productivity measures reporting should be coupled with quality metrics
Reference:

Ding A, Saini S, Berndt ER. Radiologist productivity: what, why, and how. JACR 2009;6:824-827.


Image credit: http://akalol.wordpress.com


Follow RiTradiology on Facebook, Twitter or Google Friend Connect
Visit RiT Illuminations to view nice pictures of your colleague

January 24, 2010

CT Radiation Exposure in Real Clinical Practice and Cancer Risk Estimation


Two recent studies published in the Archives of Internal Medicine in December 2009 could serve as an eye opener for every physicians ordering CT scans as well as radiologists.


Smith-Bindman et al collected CT dose data of 11 most common CT study types performed in 4 hospitals in San Francisco Bay Area. They found that there were wide variations in dose within each study type and between different types. For example, routine chest CT dose ranged from 2 to 24 mSv, routine abdomen-pelvis CT with IV contrast dose ranged from 4-45 mSv. Median effective doses for each exam were higher than they were commonly quoted in the literature, for example, 8-10 mSv is common quote for a chest CT examination. They also estimated the risk of developing cancer related to CT in several patient groups according to patient's age at the time of CT. Based on their calculation, 1 in every 80 women who undergo a chest CT for suspected pulmonary embolism at age 20 will develop cancer. Similarly, 1 in every 270 women who undergo coronary CT angiography at age 40 will develop cancer.

Berrington de Gonzalez et al utilized Medicare claim data and IMV Medical Information Division survey to project estimated age-specific cancer risk from CT studies performed in the U.S. in 2007. Excluding CT studies done for cancer diagnosis and within the last 5 years of life, 2% (29,000) excess cancers caused by CT scans in 2007 were predicted.

What is needed?
  1. Optimization and standardization of CT protocols and techniques to limit radiation
  2. Reduction of number of CT scans
  3. Collection of dose information at patient level to educate patients and health care providers about radiation exposure
References
1. Smith-Bindman R et al. Radiation dose associated with common computed tomography examinations and the associated lifetime attributable risk of cancer. Arch Intern Med 2009; 169:2078. PubMed abstract
2. Berrington de González A et al. Projected cancer risks from computed tomographic scans performed in the United States in 2007. Arch Intern Med 2009; 169:2071. PubMed abstract

Image credit: www.topnews.us

January 21, 2010

Adrenal Mass Characterization

Fig 1: Precontrast axial CT image shows a 3-cm left adrenal mass with an attenuation of 1.3 HU, indicating a lipid-rich adenoma.
Fig. 2: Precontrast axial CT image of a different patient shows a right adrenal mass with an attenuation of 20.8 HU, which is indeterminate. Note that the region of interest (ROI) measurement should cover at least half the size of the mass.


Facts:
  • Lipid-rich adenomas contain intracellular fat (microscopic level) that can be shown on CT as low attenuation
  • Adenomas wash out contrast more rapidly than malignant masses
  • Extension into IVC suggests malignancy, particularly adrenocortical carcinoma

Adrenal Mass: Adenoma Vs. Others
  1. Size: can not be definitively used to distinguish benign from malignant adrenal masses. In general, patients without known malignancy and a mass greater than 5 cm, surgical resection is advised
  2. Precontrast attenuation: less than 10 HU (sensitivity 70%, specificity 98%)
  3. Postcontrast (venous phase) attenuation: at 60-70 second delay after contrast injection, absolute enhancement of a mass of > 110-120 HU likely pheochromocytoma
  4. Delayed postcontrast attenuation: used to calculate absolute and relative percentage washout. Absolute Percentage Washout (APW) >60% or Relative Percentage Washout (RPW) >40% suggests an adenoma.
Our cases: Both cases are adrenal adenomas, the first is a lipid-rich adenoma and the second is a lipid-poor adenoma (confirmed with dynamic scans, not shown).

Reference:

Johnson PT, Horton KM, Fishman EK. Adrenal imaging with multidetector CT: evidence-based protocol optimization and interpretative practice. RadioGraphics 2009;29:1319-1331.

January 18, 2010

Ductal Carcinoma in Situ

Magnification mammography shows two separate foci of pleomorphic microcalcifications (arrows) in the left breast. There is no associated mass, architectoral distortion or lymphadenopathy.

Facts: Malignant Calcifications on Mammography
  • Small -- less than 0.5 mm
  • Clustered, segmental
  • Character -- fine granular, fine linear, branching (casting) or pleomorphic
Ductal Carcinoma in Situ (DCIS)
  • Malignant ductal epithelium without disruption of the underlying basement membrane; normal ductal architecture is preserved.
  • Pathological distinguishing feature from lobular CIS is the presence of intercellular cohesion
  • Thought to represent early stage of breast cancer
  • Several types: comedo, solid, cribiform, clinging (flat-type), mixed
  • Grading based on nuclear atypia and necrosis is predictive of prognosis
  • Patients are usually asymptomatic
Mammographic Findings
  • Cluster(s) of malignant microcalcifications
  • If an area of calcifications is larger than 2.5 cm, high likelihood of microinvasion
  • If seen with a mass, it could be an intraductal component of an invasive cancer that may require surgical removal and specimen radiography to ensure complete removal
  • Mammography should be thoroughly evaluated for multicentric (tumors in different breast quadrants) and multifocal (same quadrant) disease
Our case: Ductal carcinoma in situ, multifocal disease

References:
1. Kopans DB. Breast imaging, 3rd ed, 2007.
2. Conant EF, Brennecke CM. Breast imaging case review series, 2nd ed, 2006.

Follow RiTradiology on Facebook, Twitter or Google Friend Connect
Visit RiT Illuminations to view nice pictures from your colleague

January 15, 2010

Ectopic Origin of Right Coronary Artery

Axial CT image shows an ectopic origin of the right coronary artery (arrow) arising from the left cusp and passes between the ascending aorta and the right ventricular outflow tract in the "intraseptal" course.


Coronary Artery Anomalies
  • 1% of all patients undergoing cardiac catheterization
  • Three types: ectopic origin from a coronary cusp (like our case), absent coronary artery, ectopic origin from a main pulmonary artery
  • 20% causes life threatening symptoms such as arrhythmias, syncope, myocardial infarction or sudden death
  • MDCT can clearly show the origin and course of several forms of anomalous coronary artery.
Anomalous Coronary Crossing Between Aorta and Main Pulmonary Artery/RV Outflow
  • Either left coronary originating from the right cusp (sinus) or right coronary arising from the left cusp (sinus), if it courses between the aorta and MPA -- it is called "intervascular course" and is associated with poor outcome.
  • If it courses between the aorta and RV outflow tract inferior to the plane of the pulmonic valve, it is "intraseptal course" and considered "comparatively benign"
Reference:
Datta J, White CS, Gilkeson RC, et al. Anomalous coronary arteries in adults: depiction at multi-detector row CT angiography. Radiology 2005;235:812-818.


Follow RiTradiology on FacebookTwitter or Google Friend Connect

January 12, 2010

Lung Abscess versus Empyema


Coronal reformatted chest CT images show a lesion in the right upper lobe with internal air-filled cavity, thick irregular wall (green arrowheads) and another lesion in the left lower lung with internal fluid, thin wall (yellow arrowhead) and adjacent compression of the lung tissue (yellow arrows and box). The right upper lobe lesion is an abscess and the left lower lung lesion is an empyema.


Lung Abscess
  • Localized suppuration with destruction of lung parenchyma
  • Round, thick-walled cavity in areas of destroyed lung
  • Typically irregular wall, irregular luminal margin and exterior surfaces
  • Usually treated by prolonged antibiotics and postural drainage

Empyema
  • Pus in the pleural cavity
  • "Split pleural" sign: separation of uniformly thickened visceral pleura from parietal pleura
  • Compression of uninvolved lung
  • Usually require early tube drainage

Differentiating the Two
  • Most specific signs: "split pleura" sign of empyema, compression of adjacent uninvolved lung in empyema
  • Helpful signs: at least one wall of empyema is thin, uniform and smooth on both luminal margin and exterior surface
  • Less reliable sign: size, shape (oval vs round), chest wall angle (obtuse vs acute)

Reference:
Stark DD, Federle MP, Goodman PC, et al. Differentiating lung abscess and empyema: radiography and computed tomography. AJR 1983;141:163-167.

Follow RiTradiology on Facebook, Twitter or Google Friend Connect
Visit RiT Illuminations to view nice pictures from your colleague

January 9, 2010

Clay Shoveler Fracture


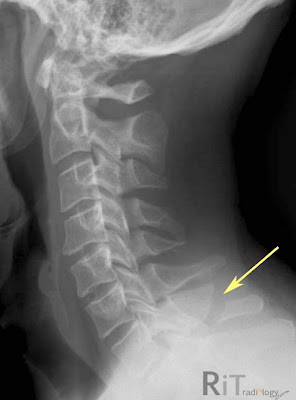
A lateral cervical spine radiograph and sagittal-reformatted CT image show an oblique fracture of the C7 vertebra with slight displacement. There is no extension to the lamina or facet joint on axial CT (not shown).


Clay Shoveler Fracture
  • Avulsion, hyperflexion injury of the spinous process of C6, C7 or T1
  • Typically oblique in orientation
  • Due to abrupt flexion of the head and neck against tensed posterior neck ligaments
  • First described in Australian clay miners who attempted to throw a shovel full of clay from the mine floor but the shovel stuck in the clay, causing abrupt hyperflexion of the neck
  • Mechanically and neurologically stable unless it extends into the lamina. Also should look for facet joint injury or dislocation
Reference:
Schwartz ED, Flanders AE. Spinal trauma: imaging, diagnosis and management, 2007, 1st ed.

Follow RiTradiology on Facebook, Twitter or Google Friend Connect
Visit RiT Illuminations to view nice pictures from your colleague

January 6, 2010

Malignant Otitis Externa

An Axial CT image of an 82-year-old diabetic man shows marked thickening of the right pinna (arrowhead) and external auditory canal (arrows) without extension to the skull base or evidence of mastoiditis.


Facts: Malignant Otitis Externa
  • Severe infection of the external auditory canal (EAC) and skull base
  • Elderly diabetics and immunocompromised patients
  • Most common organism = P. aeruginosa
  • Extension into deep structures or chronic osteomyelitis may occur without signs on local examination
  • Potential complications: osteomyelitis of the temporomandibular joint, sigmoid sinus thrombosis, meningitis, optic neuritis
  • Biopsy usually required to exclude carcinoma
Staging
  1. Stage 1 = confined to EAC and/or facial nerve paralysis
  2. Stage 2 = osteitis of the skull base and/or multiple cranial nerve involvement
  3. Stage 3 = meninges or brain involvement
Imaging
  • CT commonly used to define location, extent of disease.
  • MRI may complement CT in cases with cranial nerve, brain involvement
  • Imaging monitoring of diseases may be done with bone scan and/or gallium scan
Reference:
Okpala NCE, Siraj QH, Nilssen E, Pringle M. Radiological and radionuclide investigation of malignant otitis externa. J Laryngol Otol 2005;119:71-75.


Follow RiTradiology on FacebookTwitter or Google Friend Connect

January 3, 2010

Diffuse Axonal Injury

Figure 1: Axial FLAIR MR image shows several high signal foci (arrows and arrowhead) in the gray-white junction of the left frontal lobe in this patient status post closed head trauma (day 1 after trauma). Similar lesions are also seen in the basal ganglia.
Figure 2: Axial GRE MR (susceptibility) image shows two foci demonstrating susceptibility artifact (dark signal intensity, arrows) representing blood products. Another focus (arrowhead) shows minimal to no susceptibility, which may represent a non-hemorrhagic lesion.


Diffuse Axonal Injuries (DAI)
  • One of the most common primary traumatic brain injuries in patients with severe head trauma (up to 48% in one series)
  • Specific pattern of post traumatic diffuse degeneration of the white matter, attributed to prior shearing injury of the white matter
  • Impaired consciousness is usually greater in patients with DAI than in patients without DAI
  • Frequent cause of poor clinical outcome in patient with head injuries
Pathology
  • Only some lesions are evident on autopsy as small, focal traumatic lesions.
  • Many can be visualized only on microscopic examination as multiple axonal retraction balls (pathologic hallmark) and perivascular hemorrhage
  • With time, there are microglial and astrocytic reactive changes, endothelial proliferation and accumulation of hemosiderin-laden macrophages at the site of axon disruption
  • Three common locations: lobar white matter, corpus callosum, dorsolateral brainstem
Imaging
  • MRI much more sensitive than CT for detection and characterization of DAI lesions
  • Multiple, small, deeply situated, elliptical lesions sparing the overlying cortex
  • Lesions may be hemorrhagic or non-hemorrhagic (the latter is more common) (CT will easily overlook non-hemorrhagic lesion and small hemorrhagic petechial hemorrhage)
  • High signal intensity on T2WI, FLAIR (FLAIR more sensitive)
  • Dark signal intensity on susceptibility MR sequence (i.e. T2* GRE) of hemorrhagic lesions

References
1. Gentry LR. Imaging of closed head injury. Radiology 1994;191:1-17.
2. Parizel PM, Ozsarlak O, Van Goethem JW, et al. Imaging findings in diffuse axonal injury after closed head trauma. Eur Radiol 1998;8:960-965.

Follow RiTradiology on FacebookTwitter or Google Friend Connect

January 1, 2010

Happy New Year 2010


It's 01.01.10!

Have a very Happy New Year from the RiTradiology Team!

ShareThis